CO2.js - Overview
One day, the internet will be powered by renewable energy. Until that day comes, there’ll be a CO2 cost that comes with every byte of data that’s uploaded or downloaded. By being able to calculate these emissions, developers can be empowered to create more efficient, lower carbon apps, websites, and software.
In a hurry?
Check out our quickstart guide:
Start calculating digital carbon emissions in 5 minutes with CO2.js
What is CO2.js?
CO2.js is a JavaScript library that allows developers to estimate the emissions associated with their apps, websites and software. At its core, CO2.js takes an input of data, in bytes, and returns an estimate of the carbon emissions produced to move that data over the internet. It can be run in Node.js server environments, in the browser, as well as on some serverless and edge compute runtimes.
Why use it?
Being able to estimate the carbon emissions associated with digital activities can be of benefit to both development teams and end users. The carbon emissions of the internet are something that is abstract, and out of sight. Using CO2.js allows these emissions to be surfaced, visualised, and presented in ways that make it easier for people to comprehend and act on.
Use it in apps
It can be used in user-facing applications to give visibility to the carbon impact of user activity in the application. Users uploading files, or downloading content, could be notified of the impacts of those tasks. Large, carbon intensive, data transfers could also be blocked or limited. Users could also have the option to set a carbon budget for their browsing or use of an app, website, or online service.
Use it in development workflows
Behind the scenes, developers could look to use CO2.js as part of their deployment workflow. In the same way that web developers might set a performance budget for their site, a carbon budget could also be used. If a website or app exceeds a threshold for carbon intensity, then an alert can be raised or a new deployment can be blocked.
Use it for reporting
The data from CO2.js can also be used as part of internal monitoring tools and dashboards. Office managers and sustainability teams could also use CO2.js to track the carbon intensity of data usage within an office environment. Plugging network data usage into CO2.js can allow for monitoring and reporting on the digital usage footprint of an organisation or business.
Case studies
The above a just a few examples of the many and varied ways CO2.js can be applied to provide carbon estimates for data transfer. If you’re using CO2.js in production we’d love to hear how! Contact us via our website.
-

CO2.js Case Study – Umbraco
Umbraco is an open-source content management system (CMS) platform for publishing content on the open web and intranets. It is written in C# and deployed on Microsoft based infrastructure. It’s one of the leading .NET-based open source CMS systems and is backed by a community of friendly and proactive enthusiasts. In May 2023, Umbraco set…
-

Estimating website emissions in the italian context – Sitigreen & CO2.js
In this case study, we explore how the Sitigreen website carbon calculator uses CO2.js to perform website carbon calculations that are specific to Italian users.
-
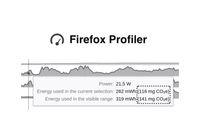
Carbon Emissions in Browser DevTools – Firefox Profiler and CO2.js
In 2023, the Mozilla introduced carbon emissions estimates into its developer tooling. This case study explores how the Mozilla team and Green Web Foundation members made this possible using CO2.js.
-

CO2.js Case Study – Step CI
Step CI is a testing and monitoring tool for APIs. In this case study, we look at how they introduced carbon emissions estimates using CO2.js.
-

CO2.js Case Study – Ecograder by Mightybytes
Ecograder is one of the pioneering tools when it comes to estimating website carbon emissions. In this case study we look at the Ecograder story, and how CO2.js helped with its most recent update.
-
CO2.js Case Study – WebPageTest
WebPageTest is one of the most trusted web performance testing tools. This case study covers how CO2.js enables the Carbon Control feature in WebPageTest.
-

Sitespeed.io – Using and contributing to CO2.js
Sitespeed.io is an open-source website performance monitoring solution that also has a sustainability plugin powered by CO2.js.
Keep updated
Receive periodic updates about the CO2.js library including information about the latest releases, future plans, ways to get involved in contributing or learning opportunities.
Join the mailing list RSS Feed
Licenses
The code for CO2.js is licensed Apache 2.0. (What does this mean?)
The carbon intensity data from Ember is published under the Creative Commons ShareAlike Attribution Licence (CC BY-SA 4.0). (What does this mean?)
The marginal intensity data is published by the Green Web Foundation, under the Creative Commons ShareAlike Attribution Licence (CC BY-SA 4.0). (What does this mean?)
Electricity Maps Grid Intensity Data - The annual grid intensity data is republished from Electricity Maps under the Open Database License (ODbL). Users of this data through CO2.js must:
- Attribute: Credit Electricity Maps as the source
- Share-Alike: Keep derivative works under the same license
- Keep open: Provide unrestricted versions if using DRM
For full details on Electricity Maps methodology see: https://www.electricitymaps.com/data/methodology For full detail on the ODbL see: https://opendatacommons.org/licenses/odbl/summary/
Data at higher-than-yearly resolution (e.g monthly, hourly etc.), or other historical and forecasted datapoints are available through Electricity Maps as a paid service. Users requiring this data should visit the Electricity Maps website for pricing and details.
-

- Home
-
-
CO2.js
- Overview
- Installation
- Roadmap
- Overview
- Overview
- perByte
- perByteTrace
- perVisit
- perVisitTrace
- Overview
- Electricity Maps
- Average intensity
- Marginal intensity
- Getting started: In the browser
- Getting started: NodeJS
- Getting started: Impact Framework
- Check a domain for green hosting
- Check a domain for carbon.txt
- Customise website carbon calculations
- Get segment-level results
-
-
-
Greencheck API
-